
Cycling like a Jumbo-Visma pro with the Leiden data model
Just like the professional riders from the Jumbo-Visma team, amateur cyclists will soon be able to analyse and improve their performance. Leiden data scientists working with the cycling team are making their smart data model available so that every serious cyclist can keep track of their fitness.
To win major race competitions like the Tour de France, optimal training is vitally important. Team Jumbo-Visma is permanently engaged in innovating and conducting studies to improve the performance of the riders. And their efforts have paid off because in the 2022 Tour de France the team ended with the yellow (general classification), green (sprint classification) and polka dot (mountains classification) jerseys.
One of the innovations relates to fitness. 'The standard way of gauging fitness is with an endurance test in a lab,' says Arno Knobbe from the Leiden Institute of Advanced Computer Science (LIACS), whose research group is working with the cycling team. 'That's an intensive workout that disrupts normal training. And it's something you can only do a couple of times a year. That means you don't know what the level of fitness is throughout the year. Our model lets you test fitness on a daily basis.'
Heart rate and wattage
Using a heart rate monitor on the body and a power meter on the bicycle, a lot of data can be gathered on the cyclists. A great deal can be learned about fitness from the relationship between heart rate and how hard a cyclist is exerting himself (wattage). But it's not a simple relationship, Knobbe explains. 'How the heart responds to exertion is a complex process. That's why in our model we have to take into account short-term exertion, the oxygen level and acidosis. The type of training also plays a role because the heart reacts differently to interval training than it does to a long climb or a time trial.'
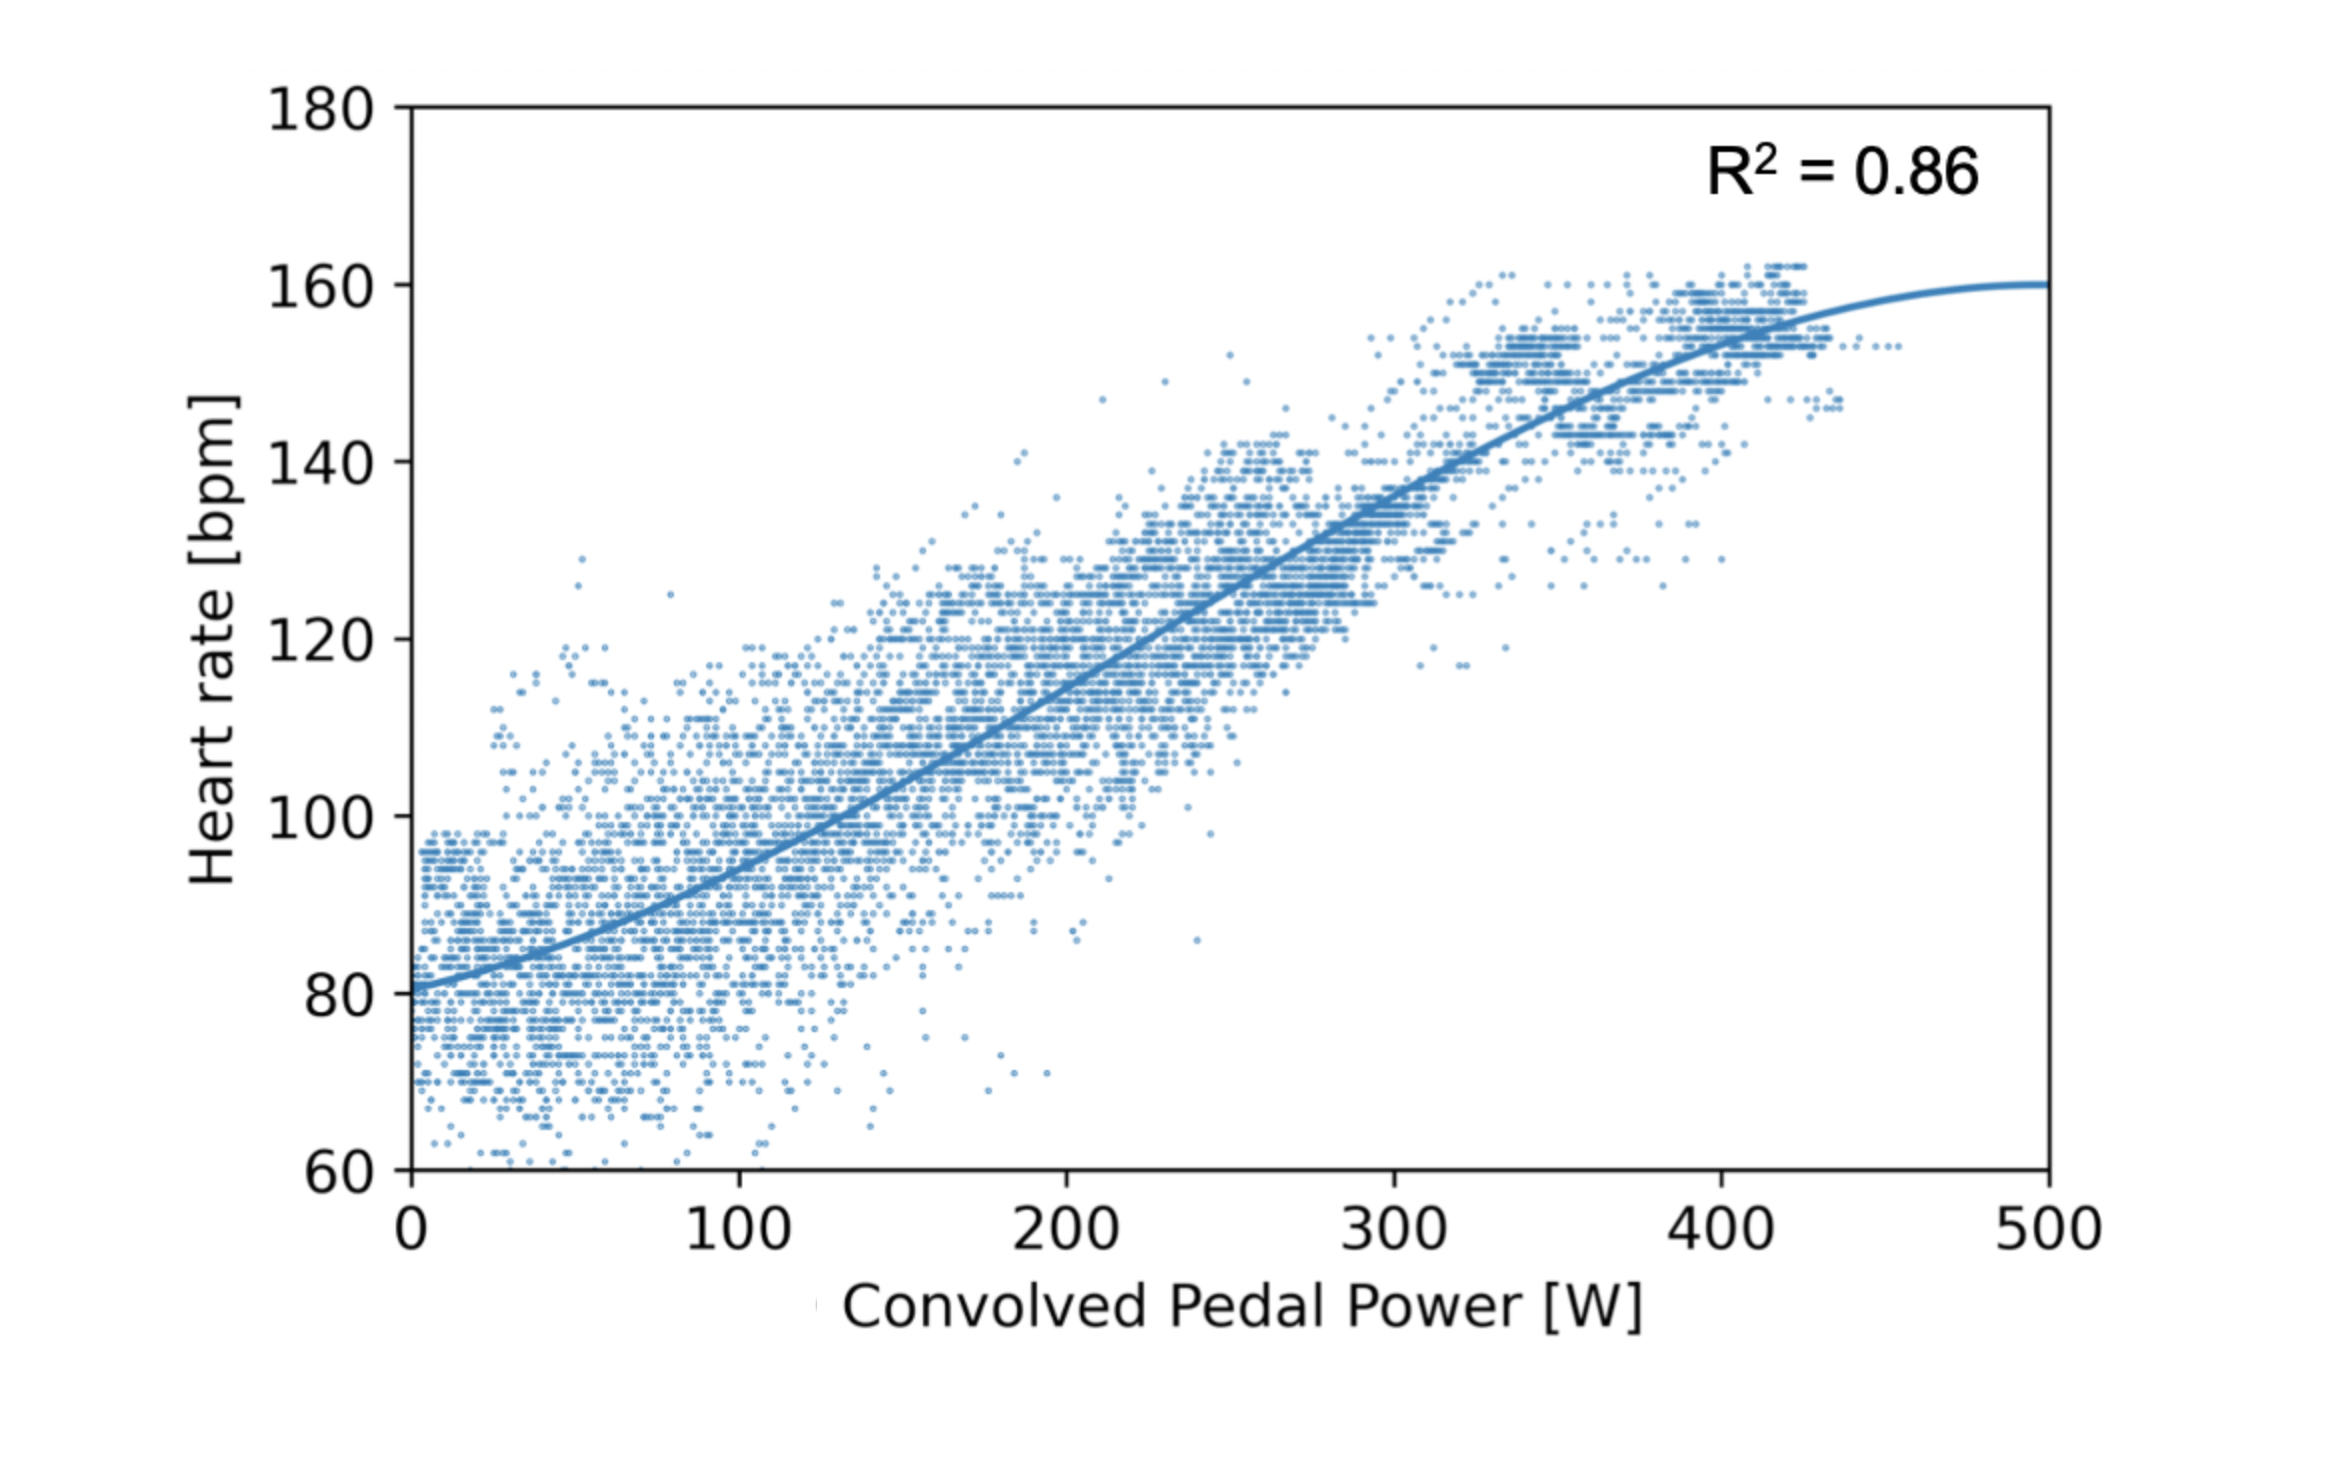
This graph shows the heart rate as a function of the wattage (the amount of power the cyclist produces).
Adjusting training
All these factors are incorporated in the data model developed by Knobbe and his team. The model now knows how the heart should react for a given level of exertion. Knobbe: ‘If we see that the heart rate is higher than predicted by the model, it shows you're less fit. And if the heart rate is lower, it means you're more fit. Riders and coaches can use these insights to adjust the training schedule.' If a rider notices that he is not at peak fitness over the course of a few days, he can tone down his training. But Knobbe believes it is even better to track the reactions of the body over a longer period. Is it a good idea to do some hard training a week before a competition, or does that have an adverse effect?
Available for everyone
In a few weeks' time, the model will be available to the general public via the Sport Data Valley national sport data platform. Amateurs can link their heart rate and power meter to an account on the platform. ‘It's important that people take measurements over a longer period, train two to three times a week and do different types of training,' says Knobbe. Otherwise they won't have a good idea of how their body responds to training.'
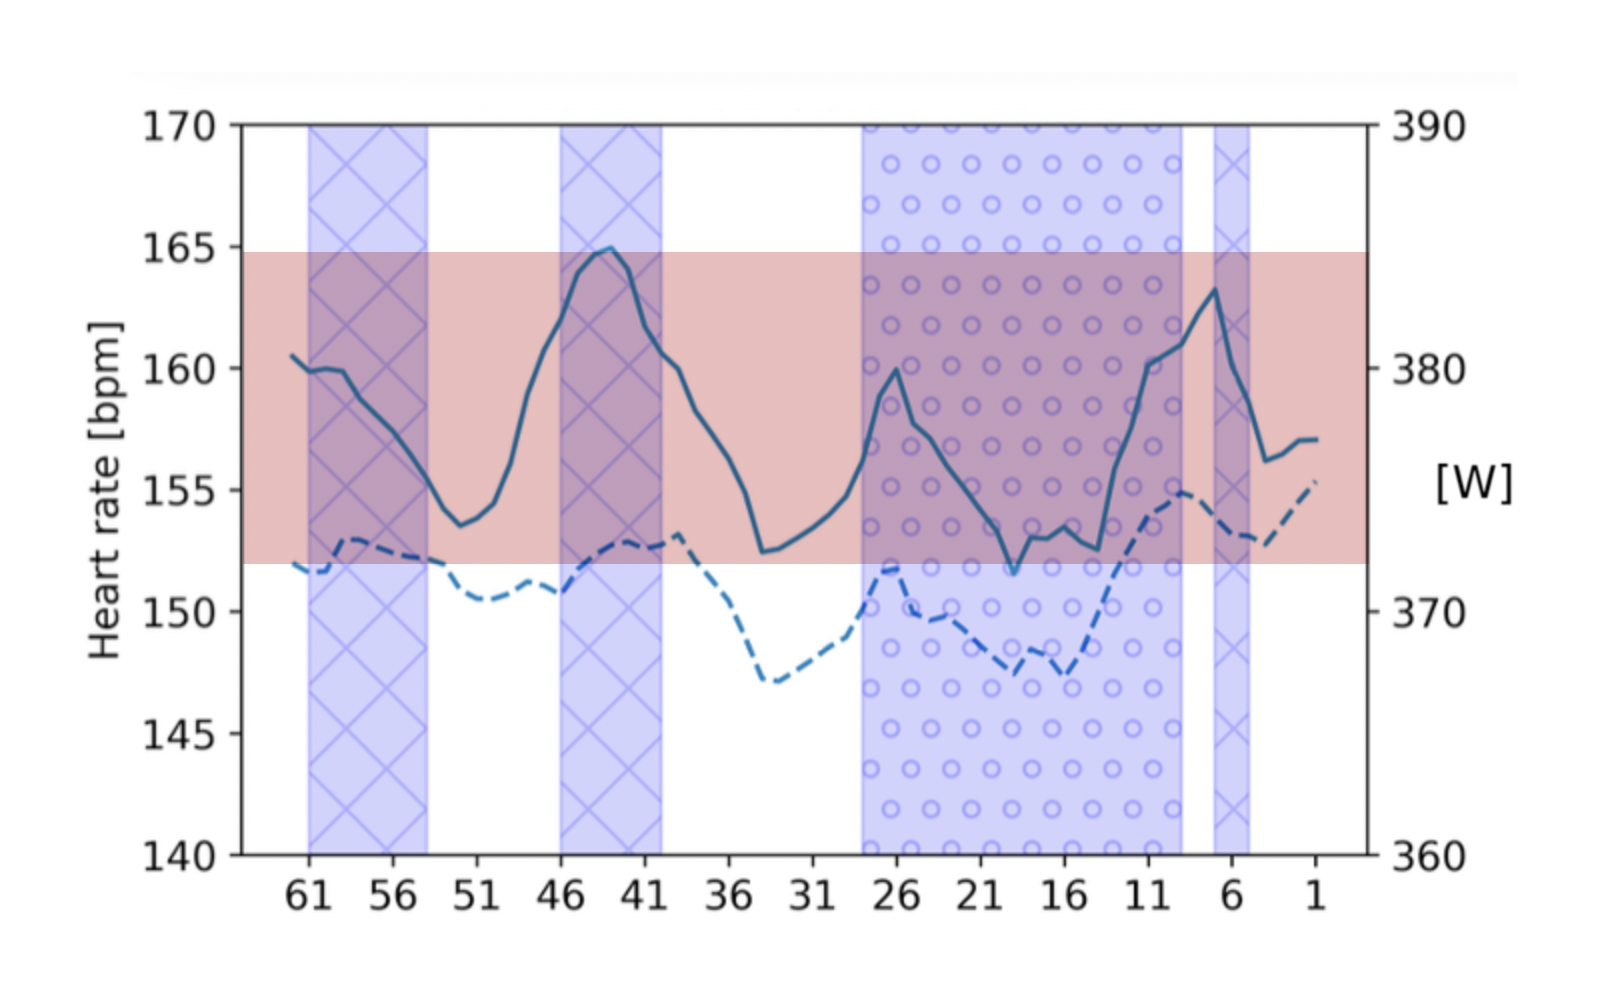
This graph shows the heart rate (dotted line and left axis) of a rider from the Jumbo-Visma team and the wattage (solid line and right axis) of the lactate threshold, the point at which acidosis starts. The time is given below, where 61 stands for '61 days ago'. The red area indicates the range of fluctuations of the lactate threshold. For this cyclist, this is between 372 and 385 watts. The lactate threshold is an indication of how fit you are. If the threshold is higher, you can increase your performance. Amateur cyclists will be able to access this kind of graph shortly op the Sport Data Valley platform.
Alternative
Although the model is currently ready for use, more research is needed. The researchers want to know how the different fitness indicators relate to the body's energy systems. And it is unclear how these indicators can be influenced by different types of training. Knobbe says that good validation is still needed. 'To know whether our readings are really reliable, we need to compare them to the gold standard, such as a fitness test in a lab. Our method could then become an accepted alternative to the strenuous exercise test.'
Text: Dagmar Aarts
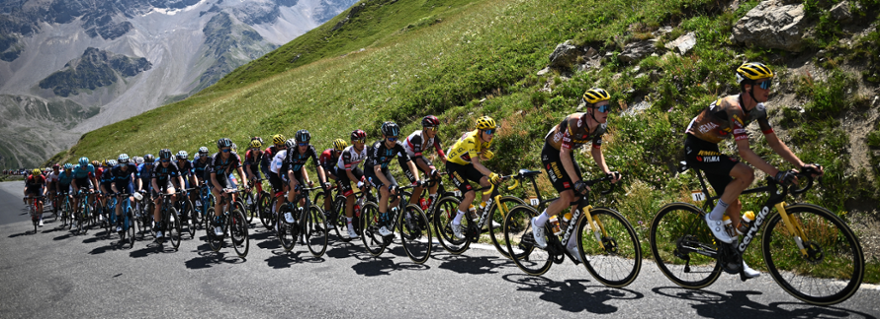
Photo: ANP