Growing super legs for the Tour de France with the aid of Leiden data science
Only the fittest cyclists stand a chance of taking yellow in the brutal Tour de France. Team Jumbo-Visma is working with data scientists from Leiden. They have analysed the stages and performance of Jumbo-Visma’s riders in previous Grand Tours. And they are researching how to determine the fitness level of general classification riders like Primož Roglič and Steven Kruijswijk.
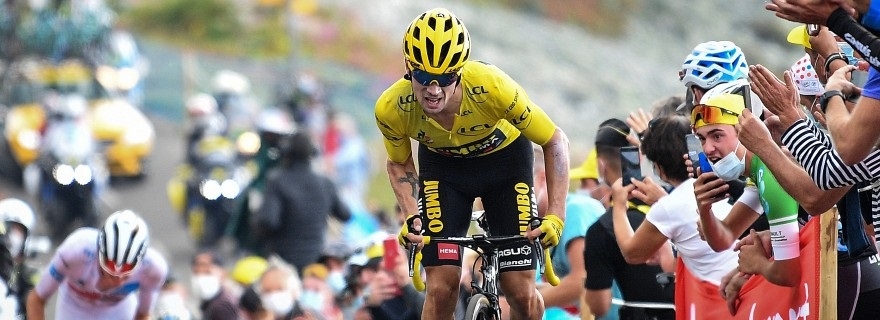
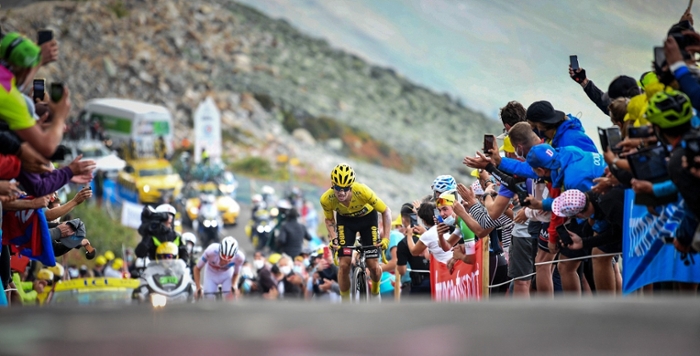
The 2020 Tour de France was a real cycling thriller for Jumbo-Visma. For an impressive 11 days the Slovenian star Primož Roglič wore yellow. Until that uphill time trial on that penultimate day, with Paris within reach, that is, when Tadej Pogacar beat Roglič by two minutes and snatched away the title. ‘My legs wouldn’t go any faster today,’ said a disappointed Roglič afterwards. ‘I couldn’t push any harder. I couldn’t ride at the watts I needed to win.’
In the cycling world it’s all about the wattage, the amount of power a cyclist can produce on the pedals. Had Roglič given too much in the stages before? That’s the question that will have haunted the cyclist and staff of this leading Dutch team for long after. This year they’re hoping for a comeback and Leiden data scientists may just be able to help.
Jumbo-Visma: ‘Data science means we can discover patterns that we wouldn’t otherwise have noticed’
Data science and cycling
After previous collaboration, the Jumbo-Visma team is working once again with data scientists from the Leiden Institute of Advanced Computer Science (LIACS). From Leiden, Arno Knobbe is leading the collaboration. He is head of the Data Mining & Sport research group. For this fervent cycling fan, the research is the opportunity to develop smart data models that can also be applied in practice.
Analyses of previous races
Knobbe’s research team has analysed the results of the classics and the Grand Tours from the past three years. What did the riders do in the days before the crucial stages and what was the result on the deciding day? Knobbe: ‘In a Grand Tour there are a number of days when a rider has to be in top form: during time trials and climbs. If they’re not fit, they’ll lose time.’ With one rider the research team discovered a particular pattern. If he reached a certain exertion level in three successive days, he would lose a few minutes the next day. For the Giro d’Italia and the Tour de France in 2020 data scientist Arie-Willem de Leeuw also went through all the stages and saw that if the rider reaches this level of exertion on these kinds of day, he’ll probably lose time on the fourth day. This makes it a better idea to take it a bit easier in the run-up to a decisive stage, by using more domestiques, for instance.

Enthusiasm at Jumbo-Visma
Jumbo-Visma is enthusiastic about the collaboration. ‘The results of this research have helped us determine our tactical approach for new races this year,’ says Mathieu Heijboer, Head of Performance at Jumbo-Visma. The days in the run-up to and during the Tour are hectic. ‘We collect a huge amount of data every day, much more than we can actually analyse. Data science is making it easier to analyse big datasets and discover patterns that we don’t notice at the moment.’
Research into general classification riders
The Leiden researchers are studying the effects of training. They are scrutinising the personal data f Jumbo-Visma’s general classification riders, such as Primož Roglič, Steven Kruijswijk and George Bennet. Knobbe: ‘If you notice that a rider isn’t completely fit on the day of the race, then it’s too late really. As a trainer you want to see how that came about historically. With our data, we are trying to find patterns that indicate this: if the individual rider is given a hard training activity at that point, it may be too much for him.’
Learning from the Jumbo-Visma skating team
Tactics mean Knobbe can’t mention specific names or examples from the cycling world. But he can give an example from his skating research for the Jumbo-Visma skating team. He discovered that Olympic skating champion Kjeld Nuis sometimes trained a bit too hard in the morning in the last five days before a competition, and ended up slightly tired when he arrived at a competition. The statistics showed that if the preparation was too hard, his performance was often lower than average. From then on the team built a threshold into the training programme. If a personal maximum exertion is reached in those last five days, a red flag appears and the schedule is scaled back.
Power meter and heart rate monitor
The general classification riders all have a power meter on their bike and wear a heart rate monitor. This makes it possible to follow what they are doing at each moment of training and to see how strenuous this is for the body. When the riders are in the vicinity of the team bus, the data are sent by wifi to the cloud. The relationship between wattage (how fast the rider is cycling) and heart rate (how strenuous this is for the body) tells us a lot about a cyclist’s level of fitness. But the relationship isn’t as simple as that because the context of the performance is equally important. Is the rider at sea level or in thin air at an altitude of 3,000 metres? And is the rider at the start of a stage or at his limit at the end of one? The researchers add all these factors to their model.

Smart balancing of data
And of course the time in the season also plays an important role. Knobbe: ‘We model the data and all the aspects that count and try to balance them in a smart way. So that, at the end of the day, we can assess how fundamentally fit the rider is and which factors might influence that.’
‘It’s all about those few percentage points of insight that will earn the riders a spot on the podium’
Training schedules
While the riders sweat on French or Italian summits, Mathieu Heijboer is puzzling it out in the Netherlands. He is the man who tries to get the riders as fit as possible for the race. The data models and recommendations from Leiden help him advise on training schedules for the individual riders. Knobbe: ‘We translate our data and make the clearest possible recommendations to the staff. We also really to try to put ourselves in the shoes of the cyclists: is it sensible to go all out on certain days or not?’ As the research hasn’t been going for that long, they are monitoring the data but won’t produce any analyses during this Tour de France.
Heijboer thinks that data science will become increasingly important in cycling. ‘It’s becoming much easier to collect data about training and competitions. The number of available wearables is growing exponentially. But this is only of use if you can interpret the data properly, and data science can definitely play a role in this.’

Gut feeling
The question is how much value all these data have. Riders and trainers know who is fit, don’t they? ‘Obviously the riders and coaches already know a lot from their gut feeling,’ says Knobbe. ‘But this is about those few percentage points in insight that mean the just win a spot on the podium or even finish first.’ Knobbe was already a cycling fan before the research began. ‘It’s particularly great for me to be so close to where it’s happening. But from a scientific perspective there are fantastic challenges too: what is the mathematical structure of these sport data and how can we make smart use of them?’ There are still various challenges to the research, Knobbe adds. ‘Cycling is a surprisingly complex sport, much more complex than ice skating, for instance, so it will still take us some time to model all the environmental factors that can be of influence.’
And there is an interesting physiological side to the research. ‘Personalisation is really important in our research. From sport science we’ve known for years how an average human body responds to different types of training, but we’re going a step further and are helping with those last few percentage points that an individual rider needs.’
Paris is still a long way away, but Knobbe can’t wait and has taken a few days off to follow ‘his’ riders intensively op tv over the next few weeks. And then he and his team will get stuck in again because the research will continue for the rest of the year at least.
Data science in sport
The data scientists from LIACS also research other sports. They’ve been researching the data and performances of the Jumbo-Visma skating team for years. And various studies are underway in volleyball and football. Rens Meerhoff, for instance, is researching the match positions of Dutch teams in the Eredivisie. He is trying to find out which situations mean more chance of success.
The collaboration with data scientists isn’t yet commonplace in cycling. Alongside Jumbo-Visma a few large teams such as INEOS and Education First work with data scientists.
Text: Linda van Putten
